In the previous tutorial we explained how to link multiple charts using SciChart.js. In this tutorial, we are going to show you how to add a Vertical Chart.
Adding a Chart
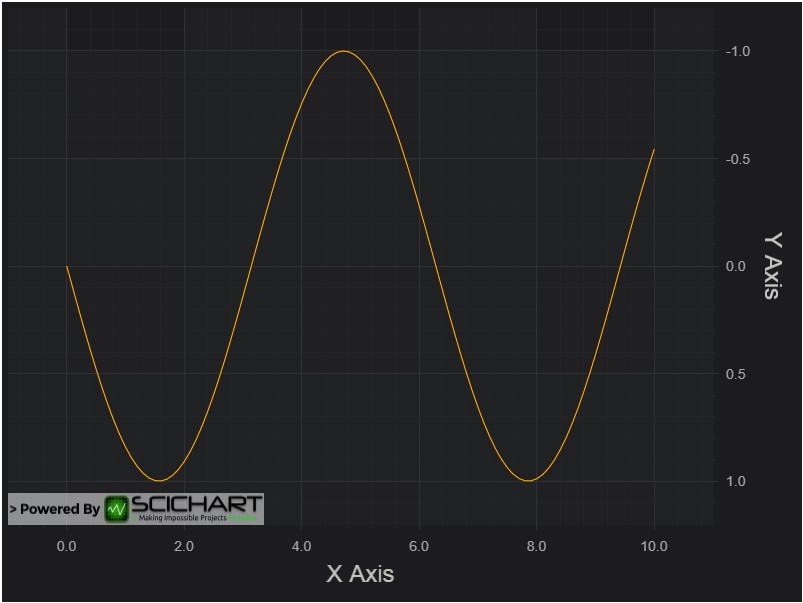
First let's create a simple Line Chart. In this example we generate a data set for sine wave and add SciChartSurface with two NumericAxis and FastLineRenderableSeries to produce the Line Chart.
index.js |
Copy Code
|
---|---|
import { SciChartSurface } from "scichart/Charting/Visuals/SciChartSurface"; import { NumericAxis } from "scichart/Charting/Visuals/Axis/NumericAxis"; import { NumberRange } from "scichart/Core/NumberRange"; import { XyDataSeries } from "scichart/Charting/Model/XyDataSeries"; import { FastLineRenderableSeries } from "scichart/Charting/Visuals/RenderableSeries/FastLineRenderableSeries"; async function initSciChart() { const { wasmContext, sciChartSurface } = await SciChartSurface.create( "scichart-root-1" ); // Generate a data set for sine wave const xValues = []; const yValues = []; for (let i = 0; i <= 100; i++) { const x = 0.1 * i; xValues.push(x); yValues.push(Math.sin(x)); } const xAxis = new NumericAxis(wasmContext); xAxis.axisTitleRenderer.text = "X Axis"; xAxis.growBy = new NumberRange(0.1, 0.1); // Use this property to flip the axis orientation xAxis.flippedCoordinates = false; sciChartSurface.xAxes.add(xAxis); const yAxis = new NumericAxis(wasmContext); yAxis.axisTitleRenderer.text = "Y Axis"; yAxis.growBy = new NumberRange(0.1, 0.1); // Use this property to flip the axis orientation yAxis.flippedCoordinates = true; sciChartSurface.yAxes.add(yAxis); sciChartSurface.renderableSeries.add( new FastLineRenderableSeries(wasmContext, { dataSeries: new XyDataSeries(wasmContext, { xValues, yValues }), stroke: "orange" }) ); sciChartSurface.zoomExtents(); } initSciChart(); |
This gives us this chart:
Making the Chart Vertical
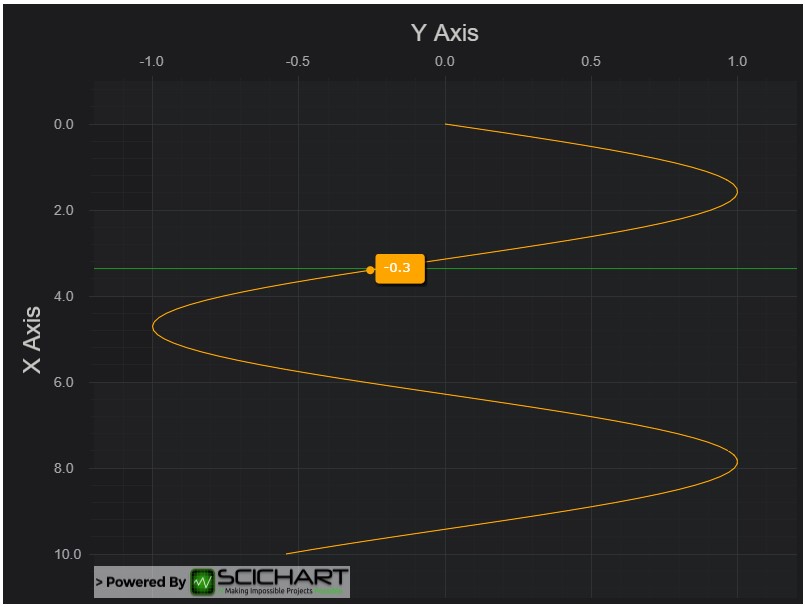
In fact, just setting X Axis Alignment to Left/Right and Y Axis Alignment to Top/Bottom makes the chart vertical. Moreover if the axes orientation needs to be inverted there is flippedCoordinates property on AxisCore class. In order to make the chart interactive we add chart modifiers such as ZoomPanModifier, ZoomExtentsModifier, MouseWheelZoomModifier and RolloverModifier.
index.js |
Copy Code
|
---|---|
... import { ZoomPanModifier } from "scichart/Charting/ChartModifiers/ZoomPanModifier"; import { MouseWheelZoomModifier } from "scichart/Charting/ChartModifiers/MouseWheelZoomModifier"; import { ZoomExtentsModifier } from "scichart/Charting/ChartModifiers/ZoomExtentsModifier"; import { RolloverModifier } from "scichart/Charting/ChartModifiers/RolloverModifier"; import { EAxisAlignment } from "scichart/types/AxisAlignment"; async function initSciChart() { ... const xAxis = new NumericAxis(wasmContext); // Make the chart vertical by setting X Axis Alignment to Left or Right xAxis.axisAlignment = EAxisAlignment.Left; // Use this property to flip the axis orientation xAxis.flippedCoordinates = false; ... const yAxis = new NumericAxis(wasmContext); // Make the chart vertical by setting Y Axis Alignment to Top or Bottom yAxis.axisAlignment = EAxisAlignment.Top; // Use this property to flip the axis orientation yAxis.flippedCoordinates = true; ... sciChartSurface.chartModifiers.add(new ZoomPanModifier()); sciChartSurface.chartModifiers.add(new ZoomExtentsModifier()); sciChartSurface.chartModifiers.add(new MouseWheelZoomModifier()); sciChartSurface.chartModifiers.add(new RolloverModifier()); } initSciChart(); |
This gives us the Vertical Chart:
Here's the completed source code for the vertical chart:
index.js |
Copy Code
|
---|---|
import { SciChartSurface } from "scichart/Charting/Visuals/SciChartSurface"; import { NumericAxis } from "scichart/Charting/Visuals/Axis/NumericAxis"; import { NumberRange } from "scichart/Core/NumberRange"; import { EAxisAlignment } from "scichart/types/AxisAlignment"; import { XyDataSeries } from "scichart/Charting/Model/XyDataSeries"; import { FastLineRenderableSeries } from "scichart/Charting/Visuals/RenderableSeries/FastLineRenderableSeries"; import { ZoomPanModifier } from "scichart/Charting/ChartModifiers/ZoomPanModifier"; import { MouseWheelZoomModifier } from "scichart/Charting/ChartModifiers/MouseWheelZoomModifier"; import { ZoomExtentsModifier } from "scichart/Charting/ChartModifiers/ZoomExtentsModifier"; import { RolloverModifier } from "scichart/Charting/ChartModifiers/RolloverModifier"; async function initSciChart() { const { wasmContext, sciChartSurface } = await SciChartSurface.create( "scichart-root-1" ); // Generate a data set for sine wave const xValues = []; const yValues = []; for (let i = 0; i <= 100; i++) { const x = 0.1 * i; xValues.push(x); yValues.push(Math.sin(x)); } const xAxis = new NumericAxis(wasmContext); // Make the chart vertical by setting X Axis Alignment to Left or Right xAxis.axisAlignment = EAxisAlignment.Left; xAxis.axisTitleRenderer.text = "X Axis"; xAxis.growBy = new NumberRange(0.1, 0.1); // Use this property to flip the axis orientation xAxis.flippedCoordinates = false; sciChartSurface.xAxes.add(xAxis); const yAxis = new NumericAxis(wasmContext); // Make the chart vertical by setting Y Axis Alignment to Top or Bottom yAxis.axisAlignment = EAxisAlignment.Top; yAxis.axisTitleRenderer.text = "Y Axis"; yAxis.growBy = new NumberRange(0.1, 0.1); // Use this property to flip the axis orientation yAxis.flippedCoordinates = true; sciChartSurface.yAxes.add(yAxis); sciChartSurface.renderableSeries.add( new FastLineRenderableSeries(wasmContext, { dataSeries: new XyDataSeries(wasmContext, { xValues, yValues }), stroke: "orange" }) ); sciChartSurface.chartModifiers.add(new ZoomPanModifier()); sciChartSurface.chartModifiers.add(new ZoomExtentsModifier()); sciChartSurface.chartModifiers.add(new MouseWheelZoomModifier()); sciChartSurface.chartModifiers.add(new RolloverModifier()); sciChartSurface.zoomExtents(); } initSciChart(); |
Further Reading
Here is related documentation for further reading: